

Revenue Operations
Billable revenue, portfolio analytics, and ML-driven intelligence.
Loading analytics...
Analytics Unavailable
ML Forecasted Revenue
At Risk
Gini Index
concentration risk
Prospects
addressable
Median Spend
per account
ML Models
trained
Loading billable revenue...
Schedule revenue for the current fiscal year
Undelivered Contracts
Total Expected Revenue
By Sales Team
| Team | Undelivered | Total | ||
|---|---|---|---|---|
| Grand Total | ||||
By Sales Rep
| Rep | Team | Undelivered | Total | ||
|---|---|---|---|---|---|
| Grand Total | |||||
By Product Category
| Category | Undelivered | Total | % of Total | |
|---|---|---|---|---|
| Grand Total | 100% |
Show your work — Excel handoff
Download every value behind the Billables KPIs as an Excel workbook: schedule line items (Billable and Undelivered), team / rep / category rollups, and excluded internal accounts — with raw + 18-char Salesforce IDs and friendly names. Hand to your SF administrators to reproduce the headline numbers from raw CRM schedule data.
Revenue Composition
Dissect booked revenue by any dimension over any window. Won opportunities only (
IsWon).
0"
@keydown.escape="composeAccountDropdown = false"
@keydown.enter.prevent="composeAccountResults[0] && selectComposeAccount(composeAccountResults[0])">
Searching…
Standard filters
Narrow won revenue in the date window before breaking down. Values ranked by $ in window.
Active:
Crunching booked revenue...
·
Line items
Revenue over time
| Revenue | % of total | Line items | Accounts | |||||||||||||
|---|---|---|---|---|---|---|---|---|---|---|---|---|---|---|---|---|
|
Loading line items…
showing top 500 by revenue
|
||||||||||||||||
| Total | ||
|---|---|---|
ML Forecasted Revenue · Active Accounts
Gini Index
At Risk
Prospects
Models
Strategy vs. Reality
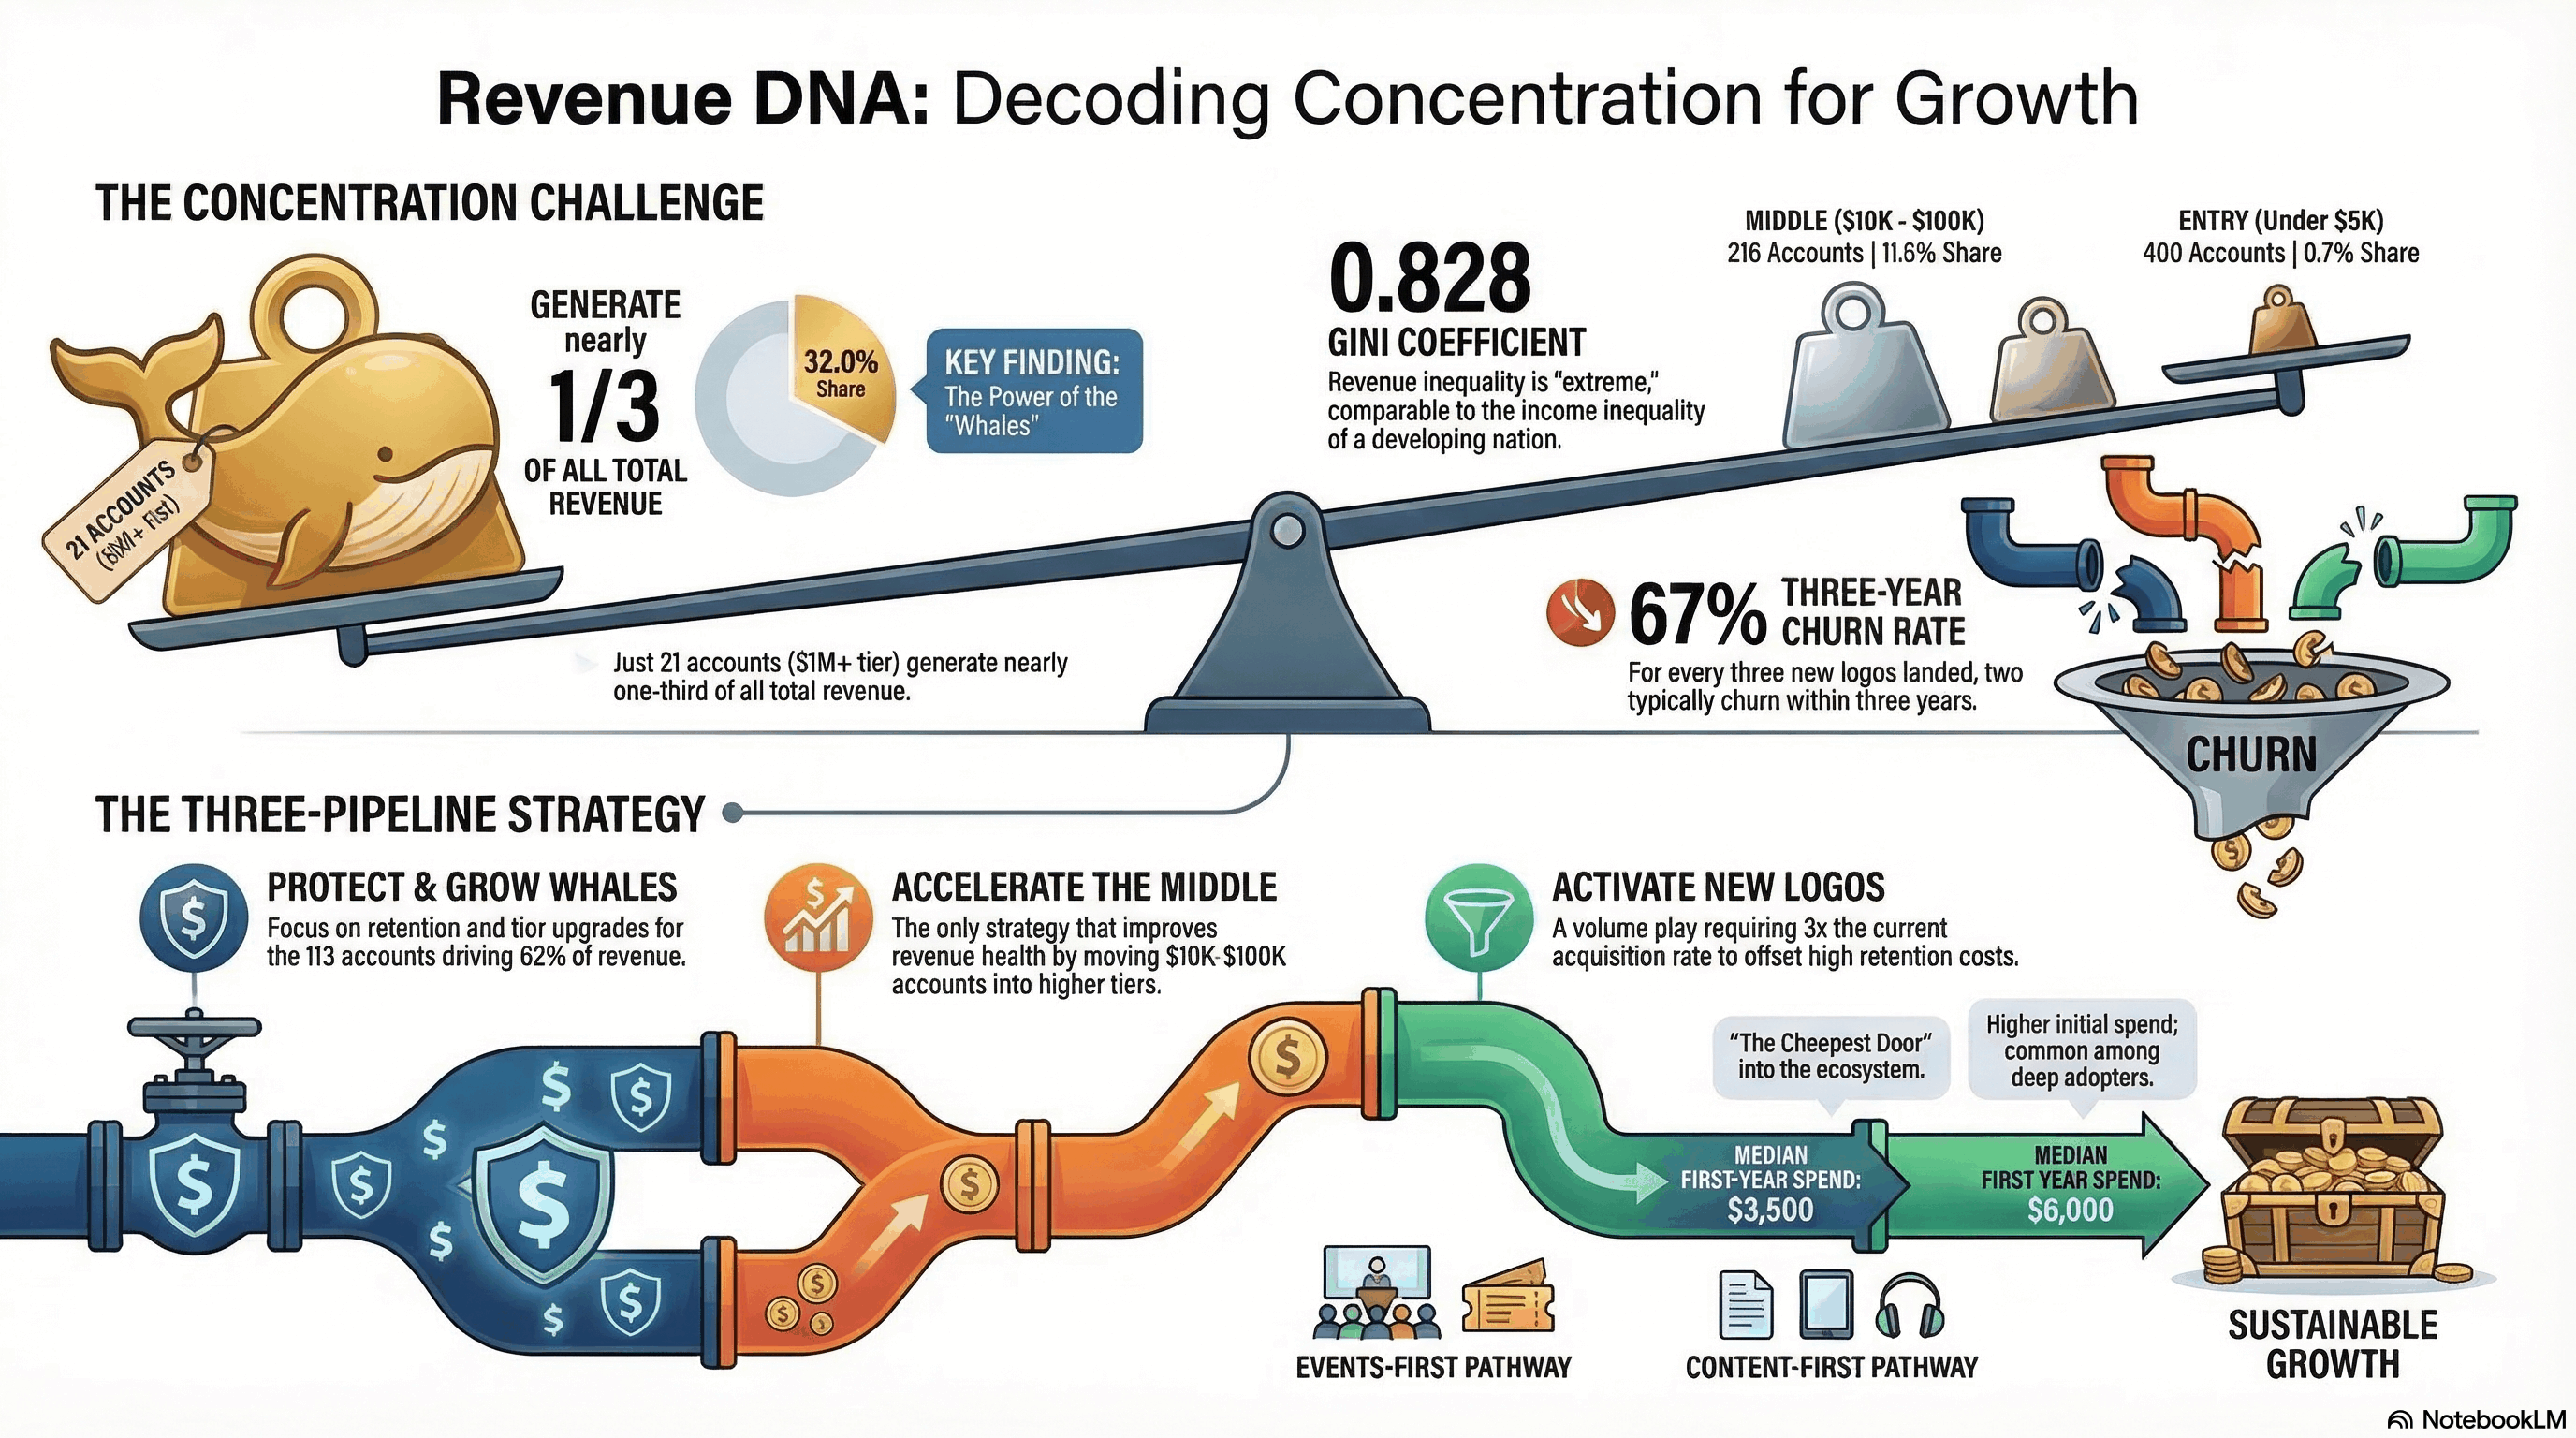
Revenue DNA
Decoding concentration for growth
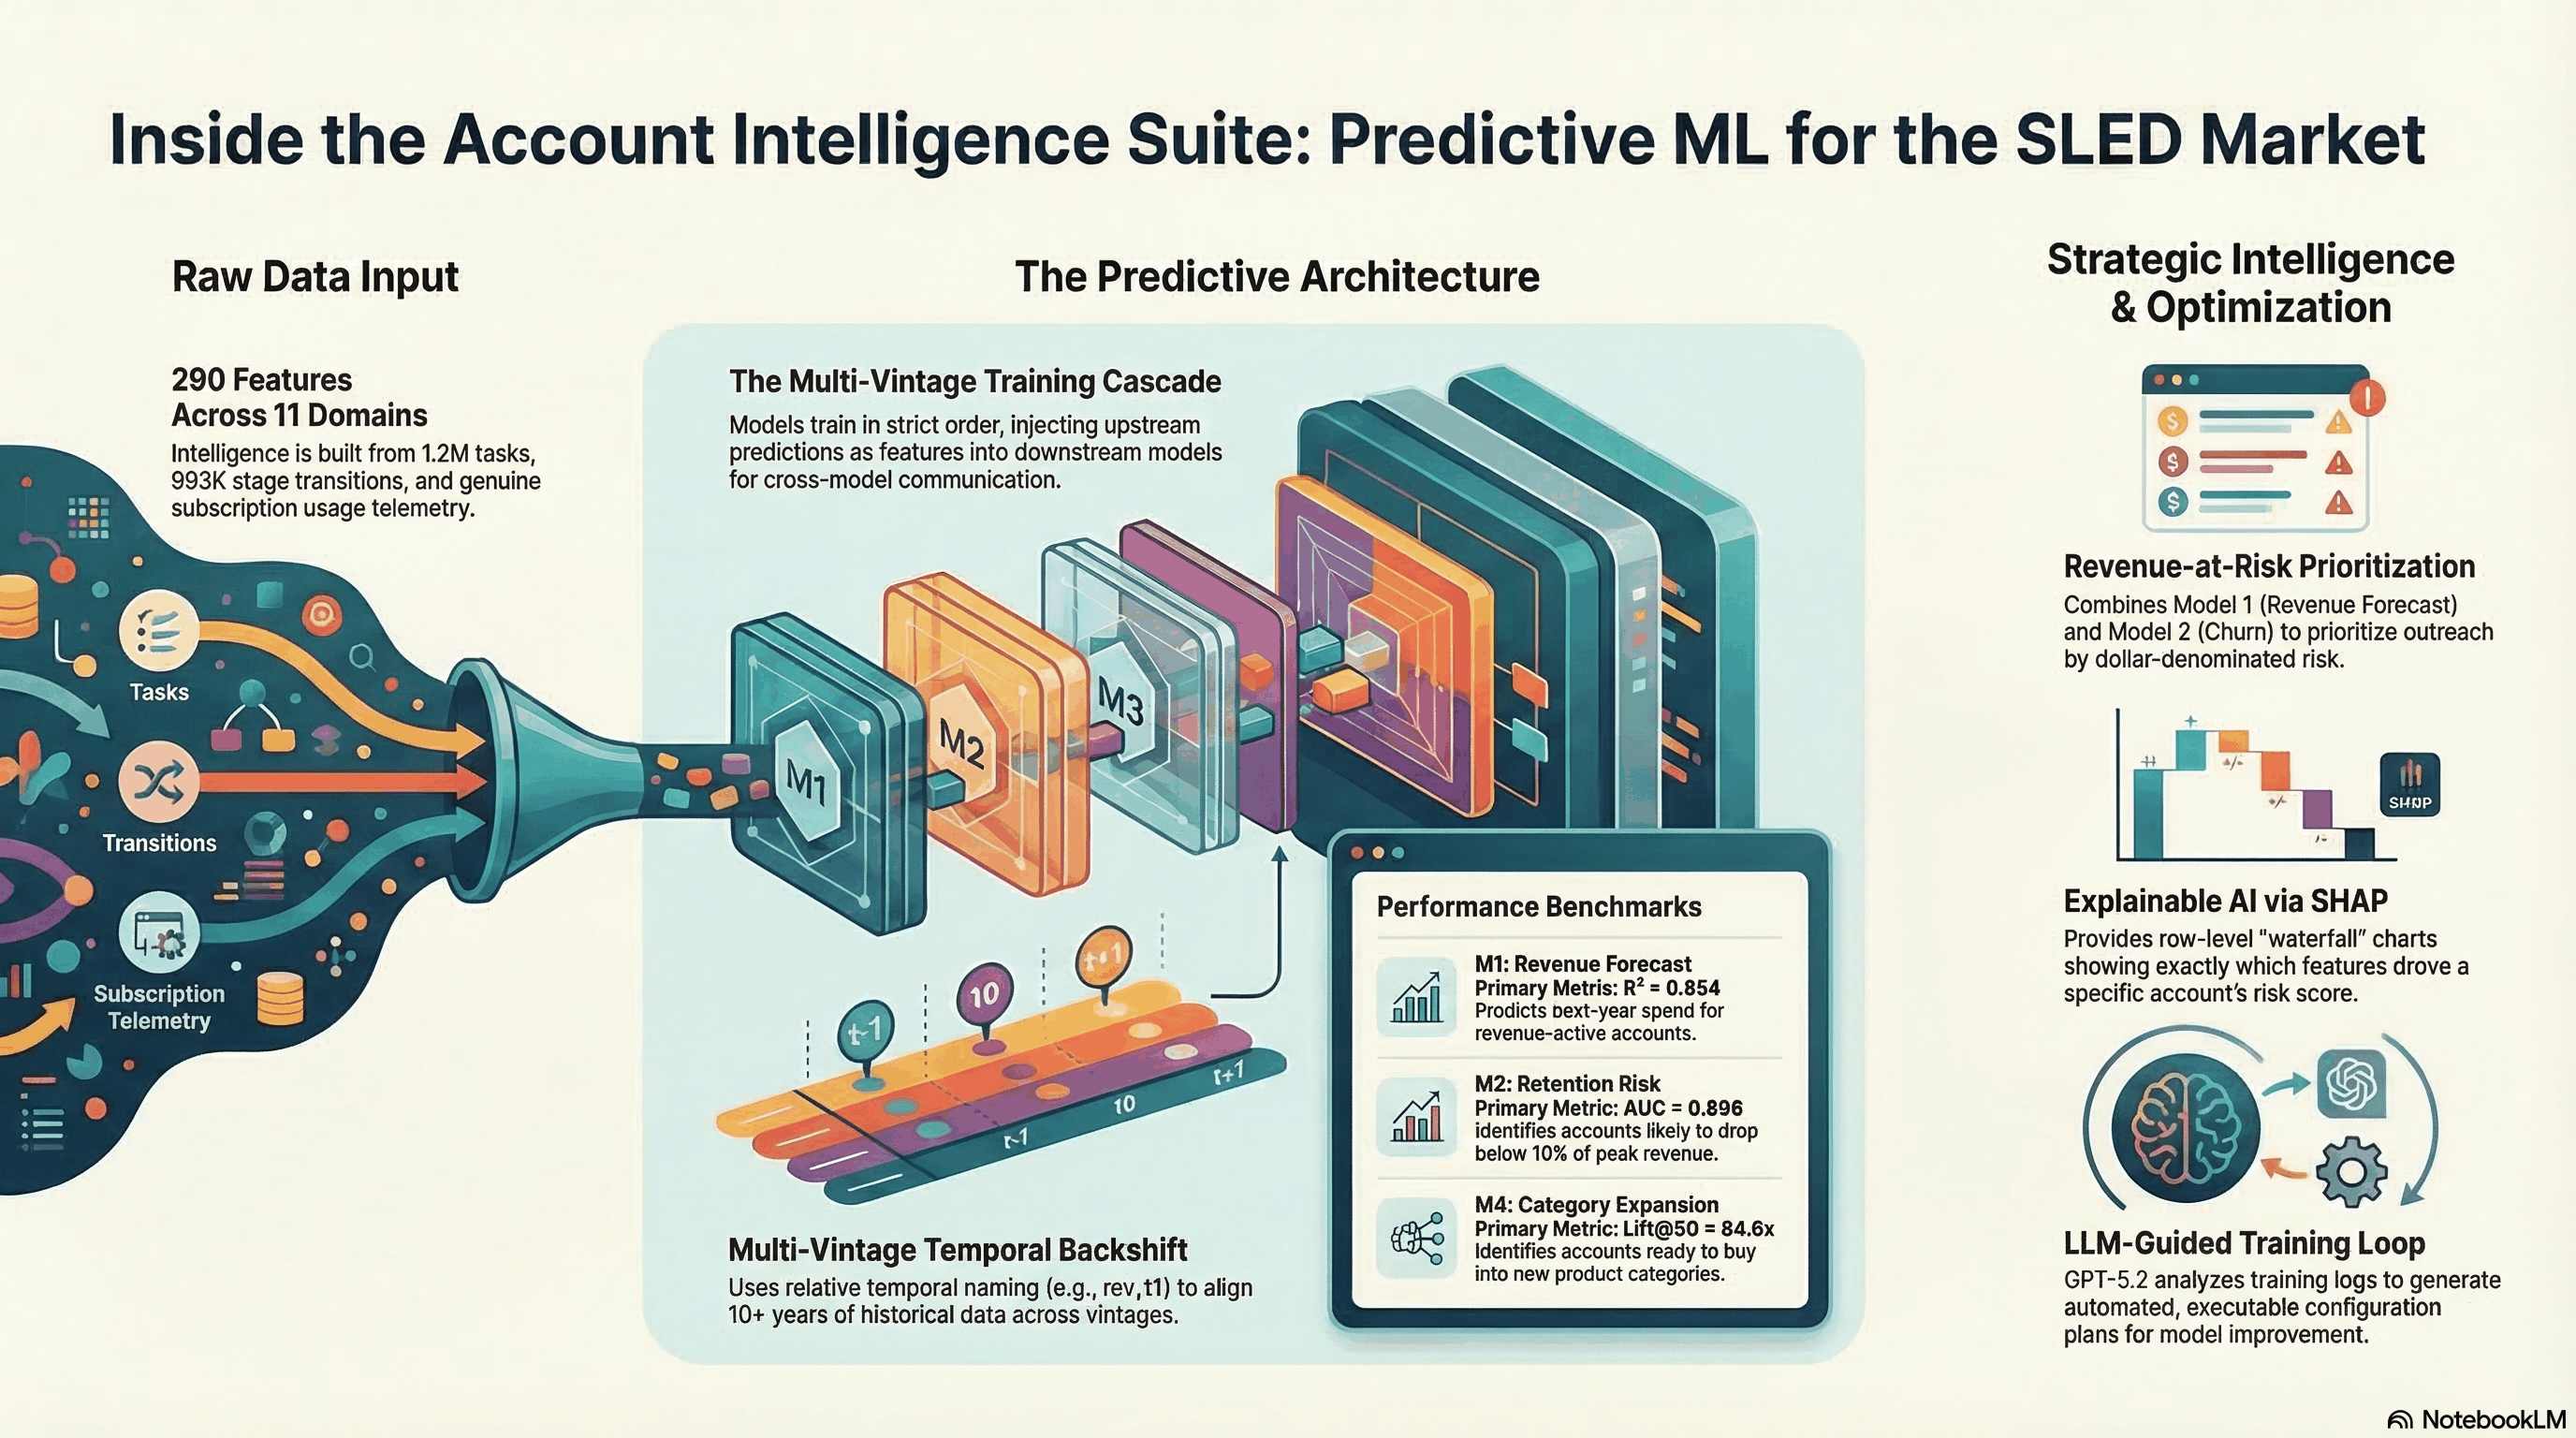
ML Pipeline
Predictive architecture for the SLED market
Events — Revenue vs Target
Events business only ·
Peak
()
Target
Revenue
Revenue X-Ray
Same revenue. Six angles. All live from ML.
BY PRODUCT — Revenue
BY REVENUE TIER — Accounts & Revenue
BY CHURN RISK — Accounts
BY BEHAVIORAL SEGMENT — Accounts
Baseline
near-zero behavioral signal
BY BRAND (2023-2025) — Revenue
SINGLE-CATEGORY EXPOSURE
buy only one product family
These accounts have the highest cross-sell potential and highest churn fragility
Loading docs...
Growth Levers
Revenue Target
New Logos
~$8K avg first-year deal
Mid-Tier Expansion
~$25K new category
Whale Growth
% increase on top 25
Revenue Waterfall
Health Impact
Revenue
Accounts
Gini
Top-10 %
Deal Benchmarks
| Category | Median | Mean | P75 |
|---|---|---|---|
Loading scenario data...
Reads page state. Ask anything.